Offshore Wind Energy Optimization Task
NGSS Performance Expectations: HS-ETS1-3, HS-PS3-3 SEPs: Constructing Explanations and Designing Solutions DCIs: ETS1.B: Developing Possible Solutions, PS3.A: Definitions of Energy, PS3.B: Conservation of Energy and Energy Transfer CCCs: Influence of Science, Engineering, and Technology on Society and the Natural World, Energy and Matter
Overview for Educators
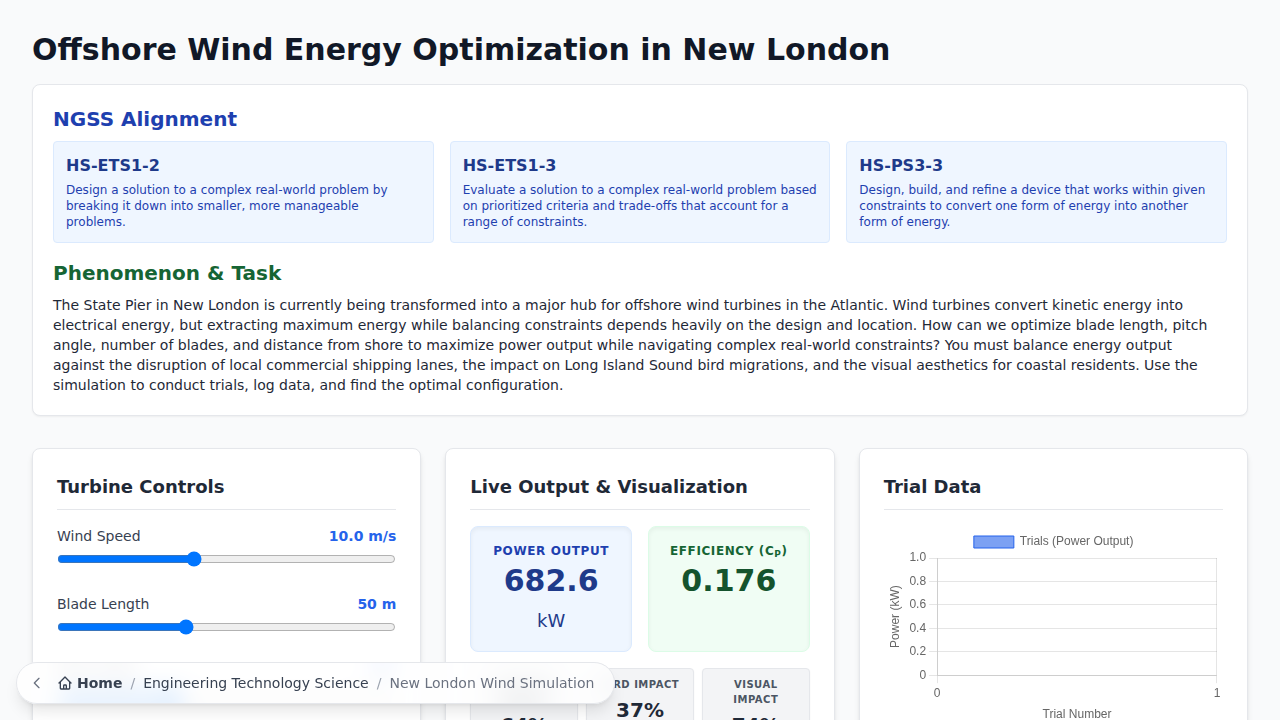
Duration: Approximately 50 minutes Prerequisites: Students should have a basic understanding of energy conservation (kinetic to electrical) and be familiar with the concept of evaluating engineering trade-offs. How it Works: In this interactive dashboard simulation, students take on the role of an engineering consultant tasked with designing an offshore wind farm off the coast of New London, Connecticut. They adjust variables such as wind speed, blade length, pitch angle, number of blades, and distance from shore, observing real-time feedback on energy output and related performance metrics displayed in the dashboard. This provides a direct, localized application of physics and engineering design concepts.
Introduction
Real-world offshore wind initiatives are rapidly expanding along the New England coast, and Long Island Sound is a critical area for this development. However, designing a wind farm isn’t just about maximizing the power generated; it’s a complex balancing act of environmental, social, and commercial priorities. The coast of Connecticut hosts vital migratory pathways for seabirds, and the Sound is a bustling corridor of shipping lanes bringing goods to major ports. Engineers must navigate these exact constraints, weighing the urgent need for clean energy against the preservation of coastal ecosystems, the local economy, and community aesthetics.
Simulation Link: Offshore Wind Energy Optimization Simulation
Scenario
The State of Connecticut is planning a major offshore wind energy project in Long Island Sound near New London. You are an engineering consultant hired to design the optimal wind farm configuration. Your goal is to maximize the energy output to power homes while strictly balancing complex, competing real-world constraints:
- Energy Conversion: Maximizing the number of megawatts generated by converting kinetic wind energy into electrical energy.
- Economic Constraints: The project has a firm budget. Adding turbines or increasing their size costs money.
- Social & Cultural Impacts: Large turbines located too close to the coast disrupt the visual aesthetics for residents and tourism.
- Environmental Impacts: The area is a key migratory path for seabirds. High turbine densities pose significant collision risks.
- Commercial Impacts: The Sound contains active shipping lanes. Turbines cannot block these routes.
Part 1: Initial Design and Trade-offs (HS-PS3-3)
- Use the simulation to design your initial wind farm. Adjust the Number of Turbines, Distance from Shore, and Turbine Size.
- Identify the forms of energy that are being converted in your design (from the wind source to the electrical output). What scientific principles govern this conversion?
- What happens when you maximize the Number of Turbines and Turbine Size without considering other factors? Describe the energy output and identify which constraints (budget, environmental, social) are violated.
- Adjust your design to keep the Total Cost under $1.5 Billion. What trade-offs did you have to make regarding the energy output and device scale?
Part 2: Evaluating Solutions Against Constraints (HS-ETS1-3)
- Using the simulation, develop three distinct design solutions, prioritizing a different constraint for each:
- Solution A: Maximize Energy Output (Aim for >800 MW, regardless of other impacts).
- Solution B: Minimize Environmental/Social Impact (Keep bird risk below 5% and visual impact below 10%, regardless of energy/cost).
- Solution C: The Balanced Optimum (Your attempt at the best overall design).
- Record the data for each solution: Energy Output (MW), Total Cost ($), Visual Impact (%), Bird Collision Risk (%), and Shipping Disruption (%).
- Analyze the strengths and weaknesses of each solution. For example, why is Solution A likely unacceptable to the public or environmental groups? Why is Solution B likely unacceptable to the energy company?
- Provide an evidence-based decision for why Solution C is the optimum design. Justify your choice by citing your simulated data and explaining how it successfully balances the prioritized criteria and trade-offs. What barriers (e.g., economic or cultural resistance) might still exist if you presented Solution C to the town council?